

Statistics
Mean (arithmetic mean), median, variance and standard deviation are calculated for a prime notation. In addition, the distribution is plotted as a histogram.
Formulas:
Mean:                x = 1/n · Σ x(i)

Variance:           s2 = 1/(n−1)·Σ(x(i) − x)2   bzw.  1/n·Σ(x(i) − x)2

Standard Dev.:  s = √s²
The median is the value, which stands in the middle of the sorted list. For an even number of values the median ist the average the two values in the center of the list.
Example:
Data:
9 6 7 7 3 9 10 1 8 7 9 6 9 8 10 5 10 10 9 11 8

Number of data        n = 21
Maximum            max = 11
Minimum              min = 1
Mean                        x = 7,7142857
Median                     c = 8
Variance                 s² = 6,1142857
Standard deviation  s = 2,4727082

               x                       H                 h
—————————   ———   ——————
         1 ≤ x < 2                 1         0,047619
         2 ≤ x < 3                 0         0
         3 ≤ x < 4                 1         0,047619
         4 ≤ x < 5                 0         0
         5 ≤ x < 6                 1         0,047619
         6 ≤ x < 7                 2         0,0952381
         7 ≤ x < 8                 3         0,142857
         8 ≤ x < 9                 3         0,142857
         9 ≤ x < 10               5         0,238095
       10 ≤ x < 11               4         0,190476

Boxplot:
Q1=6,5;   Q2=8;   Q3=9,5;   IQR=3
Left whisker=3;   Right whisker=11
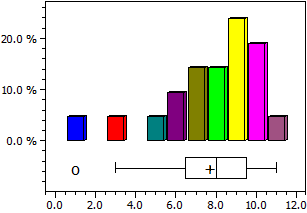
The box plot is defined by the quartiles
Q1: Median of the bottom half of the data (left edge of the box)
Q2: Median of all data (line inside the box),
Q3: Median of the upper half of the data (right edge of the box).
IQR = Q3-Q1 (Inter Qartile Range) is the width of the box.
50% of the data are within in this range.
The two whiskers show the smallest and the largest value that is no more than 1.5 times the IQR outside the box.
Values outside this range (outliers) are indicated by small circles.
The mean value is represented by a plus sign.