

Logistic Regression
The term logistic growth goes back to the Belgian mathematician Pierre François Verhulst (1804-1849), who formulated the so-called logistic equation in 1837 to describe demographic trends.
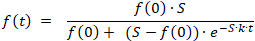
The purpose of the program is to perform a curve fit to the logistic function ƒ(t) for a series of measured values.
In addition to the measured values, an estimated upper limit of the function values (saturation limit) is entered. It is also possible to enter a factor (dark figure) by which the measured values are multiplied, assuming that the actual values are higher than the measured values.
The value pairs can either be entered in the table or imported or exported from a file in CSV format (comma separated values).
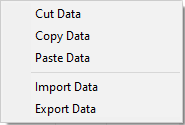
To import or export data from a CSV file, open the local menu by right-clicking on the table.
The menu items Cut Data , Copy Data and Paste Data correspond to the Cut , Copy and Paste functions of word processing and also use the clipboard.
Example 1: Hop Growth
Hops, which are required for the production of beer, are a fast growing creeper. In order to make statements about the growth of hops, the following series of measurements was made during an investigation.
| Time t (in weeks) |
0 | 2 | 4 | 6 | 8 | 10 | 12 | 16 |
| Height (in m) |
0,6 | 1,2 | 2,0 | 3,3 | 4,1 | 5,0 | 5,5 | 5,8 |
(Example from Lambacher Schweizer: Leistungskurs Analysis, Edition Baden-Wuerttemberg, 1st edition 2000)
Data from:  "hopfenwachstum.csv"

Saturation limit:  6
      Dark figure:  1

                          4,0189
ƒ(x) = ————————————————
            0,66981 + 5,3302 · e^(-0,35622·t)


Inflection point W(5,8226/3)

Maximum growth rate ƒ'(xw) = 0,53433

8 Values
Coeff.of determin.   = 0,99383916
Correlation coeff.    = 0,99691482
Standard deviation = 0,16172584
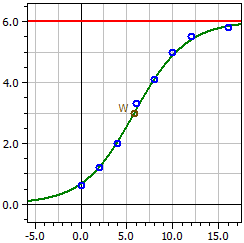
As in the book, the saturation limit was assumed to be 6. Nevertheless, the results differ from those in the book. However, there is no curve fitting, but the proportionality factor k is calculated from an arbitrary data pair, e.g. with ( 12 | 5.5 ). The data for this example are stored in the file hopfenwachstum.csv .
See also:
Example 2: Corona pandemic | Logistic Regression - Method
Wikipedia: Logistic function | Pierre François Verhulst