Hypergeometric Distribution
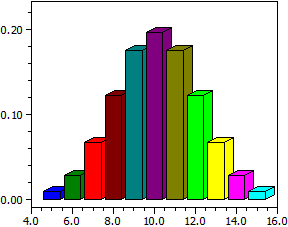
For a h(k;n;m;r) distributed random variable X with fixed n, m and r you can compute a histogram and a table of values for the probabilities
This routine is paticularly useful because, due to the four input variables, there are hardly any tables for the hypergeometric distribution and the calculation of probabilities requires a great deal of effort.
Theory:
A container is filled with m balls, r of which are red. If n balls are drawn without replacement,
then the random variable X tells, how many red balls have been drawn. The probability that k of the balls
drawn are red, is given by
The number of balls drawn n, the total number m and the number of red balls r are entered. Since the drawing proceeds without discarding, it is checked that n<m, and also r<m.
Example:
  n = 20;    m = 100;    r = 50

     k         P(X=k)            P(0 ≤ X < k)
  ——   ——————    ——————
     5       0,00889760      0,01141749
     6       0,02780501      0,03922250
     7       0,06613084      0,10535334
     8       0,12160243      0,22695577
     9       0,17460862      0,40156439
    10      0,19687122      0,59843561
    11      0,17460862      0,77304423
    12      0,12160243      0,89464666
    13      0,06613084      0,96077750
    14      0,02780501      0,98858251
    15      0,00889760      0,99748011
  ——   ——————    ——————
  P(5 ≤ k < 15) =             0,99496023